

Data manipulation is the foundation of modern software development and data analysis. At the heart of Python’s data ecosystem sits Pandas. While many developers use Pandas daily, truly understanding its core data structures unlocks deeper capabilities. This knowledge builds transferable skills that extend far beyond this single library.
Why This Understanding Matters
The power of Pandas lies not just in what it can do, but in how it thinks about data. Its core abstractions - Series and DataFrame - represent fundamental approaches to handling structured data that appear across many tools and languages. When you deeply understand these abstractions, you’re learning not just Pandas syntax, but also enduring concepts that transfer to tools like Apache Spark, R’s data.frame, and beyond.
The Problem: Why We Need Something Better
Before diving into Pandas’ solutions, let’s understand the problems it addresses. Working with data in Python presents several key challenges:
- Lists are ordered but unlabeled: Great for position-based access, but you lose meaning
- Dictionaries are labeled but unordered: Perfect for key-based lookup, but no guaranteed sequence
- Both lack vectorization: Operations require loops, making them slow for large datasets
- Neither handles missing data well: No built-in support for NULL/NaN values
Consider analyzing daily temperatures. With basic Python structures:
# Using a list - fast but meaningless indices
temps_list = [72, 68, 75, 71]
print(f"First temperature: {temps_list[0]}")  # What day is this?

# Using a dictionary - meaningful but no guaranteed order
temps_dict = {'Monday': 72, 'Tuesday': 68, 'Wednesday': 75, 'Thursday': 71}
print(f"Monday temp: {temps_dict['Monday']}")  # Good, but what about calculations?
Neither approach gives us both the benefits we need for data analysis.
The Solution: Series as a Filing Cabinet
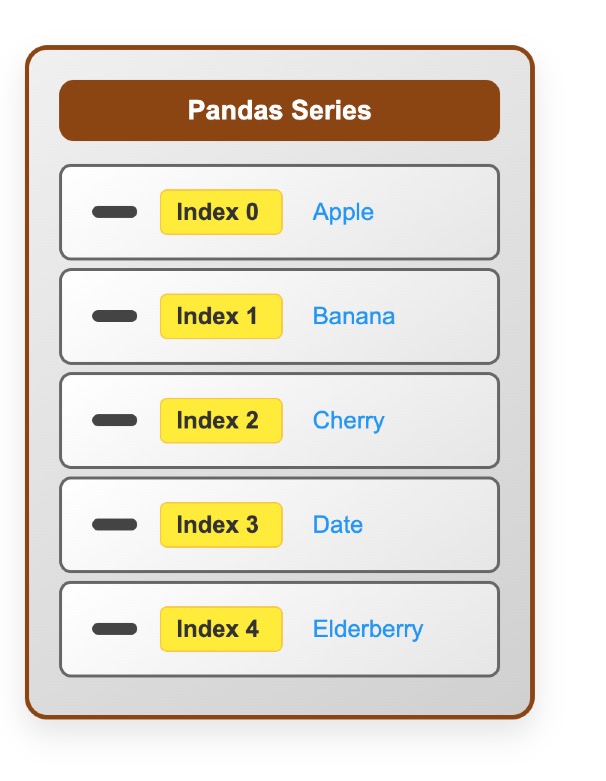
Pandas Series elegantly solves these problems by combining the best of both worlds. Think of a Series as a sophisticated filing cabinet:
- The label on each drawer is the index - meaningful names for your data
- The contents of each drawer is the value - your actual data
- The drawer number provides positional access - like a list
- The drawer label provides labeled access - like a dictionary
Now our temperature data becomes both meaningful and powerful:
import pandas as pd

# Create a Series - notice the dual structure
temperatures = pd.Series([72, 68, 75, 71],
                        index=['Monday', 'Tuesday', 'Wednesday', 'Thursday'])
print(temperatures)

# Output:
# Monday       72
# Tuesday      68
# Wednesday    75
# Thursday     71
# dtype: int64

# Access by position (like a list)
first_temp = temperatures[0]        # Returns 72
weekend = temperatures.iloc[2:4]     # Wednesday and Thursday

# Access by label (like a dictionary)
monday_temp = temperatures['Monday'] # Returns 72
weekdays = temperatures.loc['Monday':'Wednesday']

# Vectorized operations (fast!)
avg_temp = temperatures.mean()      # Automatic calculation
hot_days = temperatures[temperatures > 70]  # Boolean filtering
The Anatomy of a Series
Every Series consists of two aligned components:
# The structure
Index: ['Monday', 'Tuesday', 'Wednesday', 'Thursday']
Values: [72,      68,       75,         71]
Name: 'temperatures'
Dtype: int64
This simple design enables:
- Fast numeric operations (vectorized like NumPy)
- Intuitive labeled access (meaningful like dictionaries)
- Flexible reindexing and alignment (automatic data matching)
- Built-in missing data handling (NaN support)
- Natural time-series operations (datetime indexing)
Why This Design Is Powerful
Automatic Data Alignment
One of Series’ most powerful features is automatic alignment during operations. When you perform calculations between Series, Pandas automatically matches up the indices:
# Two Series with different, overlapping indices
week1_temps = pd.Series([72, 68, 75], index=['Mon', 'Tue', 'Wed'])
week2_temps = pd.Series([70, 73, 69, 71], index=['Tue', 'Wed', 'Thu', 'Fri'])

# Automatic alignment - only matching indices are calculated
temp_diff = week2_temps - week1_temps
print(temp_diff)
# Output:
# Mon    NaN  # No matching data
# Tue    5.0  # 73 - 68
# Wed   -6.0  # 69 - 75
# Thu    NaN  # No matching data
# Fri    NaN  # No matching data
This automatic alignment prevents common data analysis errors and makes operations intuitive.
Time Series: Where Series Really Shine
Series become exceptionally powerful when working with time-based data. The index can hold datetime objects, unlocking specialized time-series functionality:
# Create a time series
dates = pd.date_range('2023-01-01', periods=5, freq='D')
stock_prices = pd.Series([100, 105, 103, 108, 106], index=dates)
print(stock_prices)

# Output:
# 2023-01-01    100
# 2023-01-02    105
# 2023-01-03    103
# 2023-01-04    108
# 2023-01-05    106

# Time-based selection
print(stock_prices['2023-01-03'])  # Single day
print(stock_prices['2023-01-02':'2023-01-04'])  # Date range

# Built-in time series operations
print(stock_prices.resample('2D').mean())  # Downsample to every 2 days
print(stock_prices.rolling(window=3).mean())  # 3-day moving average
This datetime awareness makes Series ideal for financial data, sensor readings, logs, and any time-ordered information.
The Broader Impact: Beyond Pandas
Design Principles That Transfer
The Series design embodies principles that appear throughout modern data tools:
- Labeled Data: Meaningful indices over positional access
- Vectorization: Bulk operations over element-by-element loops
- Alignment: Automatic matching of related data
- Type Awareness: Different data types handled appropriately
- Missing Data: Explicit handling of incomplete information
These patterns appear in:
- Apache Spark: Distributed DataFrames with similar indexing
- R: data.frame and tibble structures
- SQL: Indexed tables and automatic joins
- NumPy: Vectorized array operations
Performance Characteristics
Understanding Series performance helps you write efficient code:
# Fast: Vectorized operations
result = temperatures * 1.8 + 32  # Convert to Fahrenheit

# Slow: Element-by-element loops
result = pd.Series([temp * 1.8 + 32 for temp in temperatures])

# Fast: Boolean indexing
hot_days = temperatures[temperatures > 70]

# Slow: Manual filtering
hot_days = pd.Series([temp for temp in temperatures if temp > 70])
Key Takeaways
- Series solve real problems: They combine the best of lists (order) and dictionaries (labels) while adding vectorization and missing data support
- The filing cabinet metaphor: Each drawer has both a number (position) and a label (index), giving you flexible access patterns
- Automatic alignment: Operations between Series automatically match indices, preventing common errors
- Time-series power: Datetime indices unlock specialized functionality for temporal data
- Transferable concepts: These design patterns appear across the entire data science ecosystem
Next Steps
Ready to put these concepts into practice? Continue with our hands-on implementation guide:
- Pandas Series in Practice: A Hands-On Implementation Guide - Learn to create, manipulate, and analyze data with real-world Series examples
Additional Resources
Official Documentation
- Pandas Series Documentation - Complete API reference
- Pandas User Guide - Official introduction to Series
In-Depth Articles
- Modern Pandas - Tom Augspurger’s comprehensive modern pandas techniques
- Effective Pandas - Best practices and patterns for pandas usage
- Python Data Science Handbook - Chapter 3 - Jake VanderPlas’s foundational pandas guide
Performance and Advanced Topics
- Pandas Performance Tips - Official performance optimization guide
- Why Pandas Uses So Much Memory - Understanding memory usage patterns